
DHAKA CANTONMENT, BANGLADESHINDEPENDENT IDEAS. LASTING EDITIONS.
AP-SS-2026-01|SelenSync: Engineering Lunar South Pole Mission Intelligence
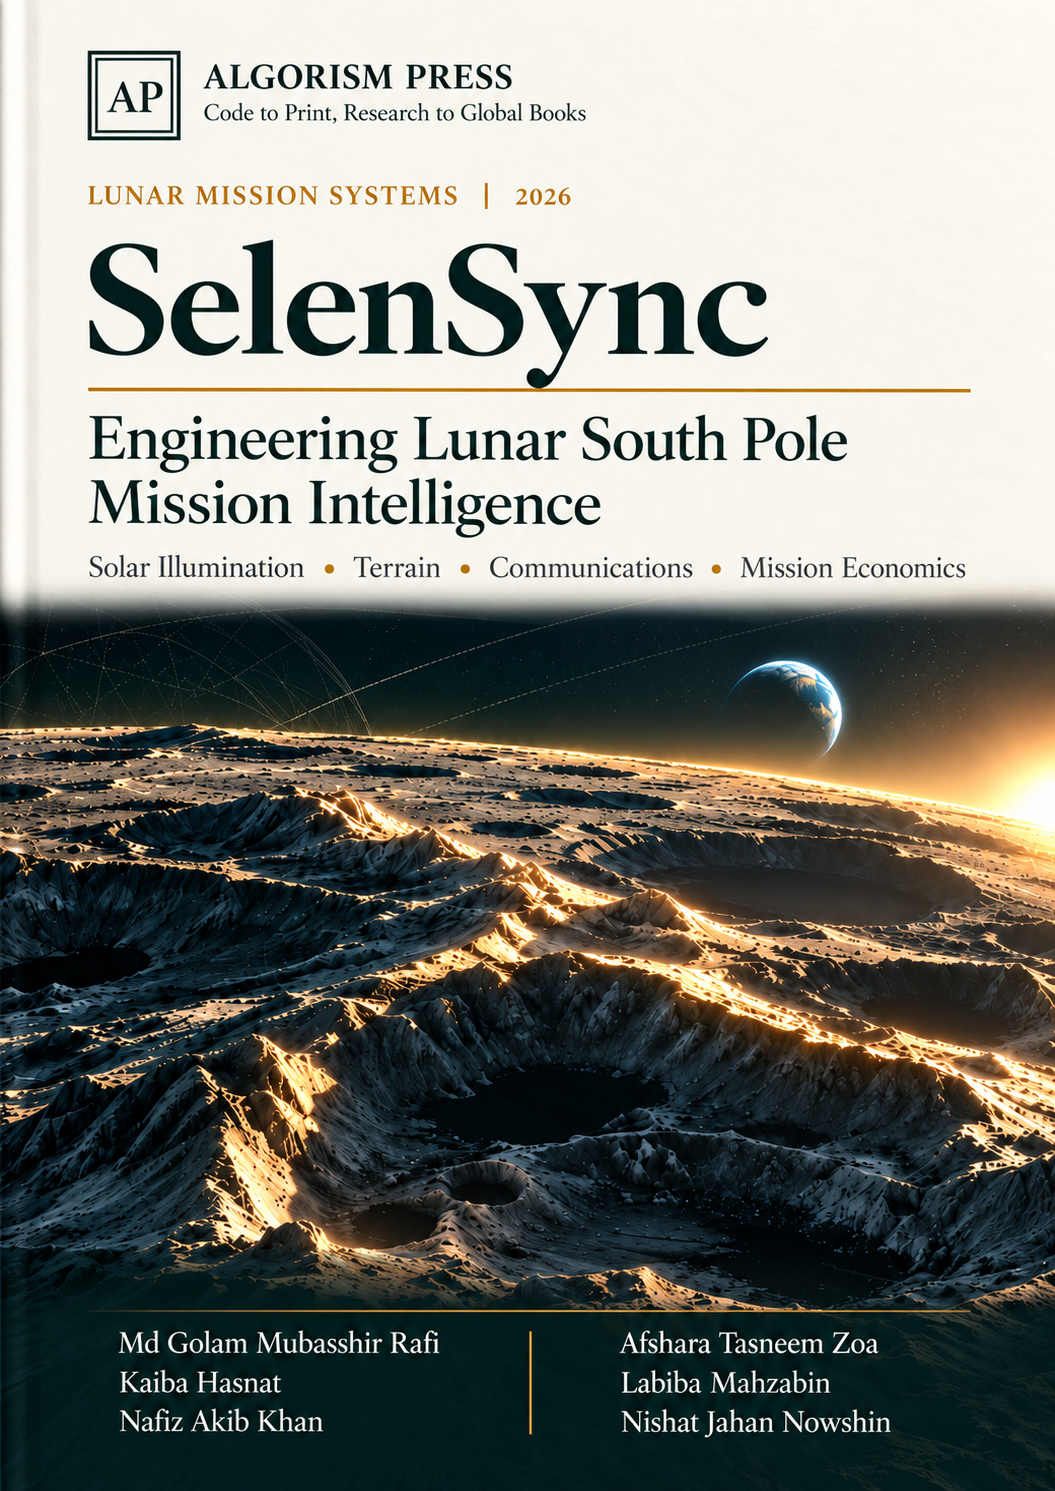
SelenSync: Engineering Lunar South Pole Mission Intelligence — Official Book Cover
FIRST EDITION · 34 PAGESREF: AP-SS-2026-01
ALGORISM PRESS | LUNAR MISSION SYSTEMS MONOGRAPH 2026

SelenSync: Engineering Lunar South Pole Mission Intelligence

Solar Illumination  •  Terrain Analysis  •  Communications Architecture  •  Mission Economics

Md Golam Mubasshir Rafi1*,Afshara Tasneem Zoa2,Kaiba Hasnat2,Labiba Mahzabin2,Nafiz Akib Khan2,Nishat Jahan Nowshin2

1Army Institute of Business Administration, Sylhet  • 2BRAC University

* Corresponding Author — ORCID: Rafi: 0009-0007-4015-8354  |  Zoa: 0009-0004-9322-8465

PublisherAlgorism Press, Dhaka Cantonment (2026)
Publication DateOctober 24, 2026
Print ISBN978-984-35-8942-1
Digital ISBN978-984-35-8943-8
Project & EditionSelenSync CFSBR SpaceWeb / First Edition (Ref: AP-SS-2026-01)
DOI10.XXXX/algorismpress.2026.01 (Pending Prefix Activation)
Copyright© 2026 The Authors. Published under Algorism Press Scholarly Terms.
PREFACEp. 03

PREFACE: From Maps to Decisions

The lunar south pole offers an unusual mission design problem. Favorable solar exposure can be separated from radio visibility by a nearby ridge; a low-angle Sun can create long shadows even when spacecraft geometry appears benign. The difficulty is not any single calculation. It is the need to combine scientific geometry, terrain data, communications constraints, and practical mission economics in one decision process.

SelenSync was developed by a multidisciplinary team working across finance, computing, electrical engineering, telemetry, and geospatial analysis. This book explains the engineering ideas that guide the platform and describes a reproducible way to interrogate its outputs. It is written for students, mission analysts, researchers, and institutional readers who want to distinguish useful screening information from flight-qualified evidence.

An interactive dashboard may display an altitude, a solar margin, or a downlink value to several decimal places. Precision of presentation, however, is not the same as accuracy. Elevation depends on terrain resolution and vertical datum; visibility depends on epoch and reference frame; radio margin depends on antenna assumptions. Every strong result is accompanied by its definition, provenance, and uncertainty.

INTERPRETING RESULTS

The worked calculations in this book explain methods and assumptions. Operational use requires independent verification with the relevant datasets and hardware parameters.

01  /  CONTEXTp. 6

The polar mission problem

Why the best illuminated site is not automatically the best landing site.

Unlike most lunar latitudes, the polar regions are governed by grazing solar elevation. A modest topographic rise can block the Sun, while nearby crater floors can remain shadowed for extremely long periods. NASA visualizations show that low-angle sunlight and terrain together create intricate temporal illumination patterns. A landing-site assessment therefore needs more than a single photograph or a latitude and longitude.

Candidate sites must satisfy several simultaneous constraints: a safe local slope and landing ellipse; usable sunlight across critical mission phases; sufficient stored energy during darkness; feasible direct-to-Earth communications or an available relay path; and scientific access to priority terrain. The constraints interact. A ridge selected to increase solar power may narrow antenna pointing corridors, while a low, scientifically attractive basin may impose a larger energy reserve.

SelenSync organizes these constraints as a sequence of models rather than an opaque score. A mission analyst should specify the site, time interval, model versions, and hardware assumptions before comparing alternatives. The most useful output is not a single ranking. It is a traceable explanation of which assumption drives the ranking and where the trade-off reverses.

ENGINEERING NOTE:An integrated decision begins with the same epoch and coordinate reference in every subsystem.
02  /  SYSTEM DESIGNp. 7

A coupled intelligence workflow

From geospatial inputs to interpretable trade-offs.

The platform is organized around distinct but connected operations. A geometry layer evaluates apparent Sun and Earth directions at a lunar surface point. A terrain layer derives a horizon silhouette from sampled elevations. Visibility logic combines these layers to classify potential sunlight and Earth line-of-sight. Power and radio models translate geometry into engineering outcomes, and a techno-economic layer converts design changes into costs or risks.

This modular organization matters because each model has a different error budget. An ephemeris can be temporally precise while a terrain grid remains spatially coarse. A radio equation may be physically correct yet operationally incomplete if antenna gain or station scheduling is unavailable. Treating modules separately allows sensitivity analysis, unit testing, and substitution of higher-fidelity datasets without rewriting the entire workflow.

A successful interface should report coordinates, timestamps, lunar reference frame, DEM resolution, horizon sampling increment, equipment assumptions, and validity flags alongside every result. It should also allow an analyst to export the calculation inputs. Reproducible assumptions are more valuable than a polished display that cannot be reconstructed.

ENGINEERING NOTE:Independent computational layers preserve auditability.
03  /  COORDINATESp. 8

Site geometry and reference frames

A coordinate is a scientific statement, not merely a map pin.

A lunar site is usually supplied by selenographic latitude and longitude, but downstream calculations require an agreed body-fixed frame, a lunar radius or shape model, and a time standard. Latitudes near the pole create numerical and interpretive pitfalls because very different longitudes converge in physical space. The same angular error can have a different surface distance depending on latitude.

The outward surface normal, not a screen projection, defines local zenith. To calculate a direction as observed from a site, start with a geocentric or selenocentric body-fixed vector for the observer and subtract it from the target vector. Transform that displacement into the local east, north, and up basis. Elevation is the angle above the tangent plane; azimuth is measured around that plane using a stated convention.

For model comparisons, store longitude convention explicitly, for example east-positive in degrees. Do not silently mix geodetic and planetocentric coordinates or presume that a DEM and ephemeris package use the same axes. An integration test at known equatorial and polar sites is a simple safeguard against frame and sign errors.

Elevation = arcsin(s · U)(03.1)

Local topocentric elevation angle relative to outward surface normal U and unit target direction vector s.

ENGINEERING NOTE:Store latitude, east-positive longitude, frame identifier, altitude datum and epoch together.
04  /  DATA FOUNDATIONp. 9

LOLA and terrain information

Terrain fidelity sets the limit of skyline fidelity.

NASA's Lunar Reconnaissance Orbiter carries the Lunar Orbiter Laser Altimeter, which maps lunar elevation and terrain morphology. For polar planning, elevation models support slope screening and topographic shadow reconstruction. Their exact pixel spacing, vertical uncertainty, interpolation behavior, and longitude convention must be identified from the dataset being used.

A quoted resolution such as 128 pixels per degree is an angular sampling, not a uniform fixed distance in every direction near the pole. Grid spacing changes with latitude, and interpolation can smooth narrow ridges or small crater walls. If the critical obstacle is near the limit of pixel resolution, the model may misclassify brief windows of sunlight or communications.

A robust DEM workflow records source product, release, projection, missing-data mask, interpolation kernel and checksums. The system should distinguish measured relief from resampled relief. If a nearby site lies in a missing tile or the line-of-sight crosses an unresolved terrain zone, the proper outcome is an uncertainty flag rather than an invented clear horizon.

ENGINEERING NOTE:An illustrative horizon profile reveals how distant ridges affect line of sight.
05  /  VISIBILITYp. 10

Constructing a 360° skyline

Ray sampling translates topography into a local obstruction model.

Choose a fixed observer location, instrument height and maximum tracing distance. At each azimuth, sample the elevation model along the ground range and estimate the apparent elevation of each encountered terrain point. The highest apparent angle becomes the obstruction angle for that azimuth. Repeating this search over 360° produces a polar skyline function h(A).

The sampling strategy matters. A one-degree azimuth step is useful for interactive screening, but narrow features may fall between rays. A coarse radial increment may miss a ridge crest. For an operational assessment, convergence tests should reduce both azimuth and range increments until the computed blocked intervals stabilize within a defined tolerance.

SelenSync can compare solar or Earth elevation E(A,t) with the skyline at that azimuth. A visible-direction flag requires elevation above the horizon plus a safety allowance that accounts for uncertainty, atmospheric irrelevance on the Moon notwithstanding. A binary result alone is insufficient: report the signed clearance E − h and its uncertainty bound.

Clearance(A, t) = Elevation(A, t) − Horizon(A)(05.1)

Signed angular clearance at azimuth A and epoch t relative to interpolated horizon mask Horizon(A).

ENGINEERING NOTE:Ridge peaks create intermittent windows despite positive geometric elevation.
06  /  CELESTIAL MECHANICSp. 11

Solar ephemeris and elevation

Derive the direction at the actual site and time.

The lunar south pole is frequently described as a region of low Sun angles. That statement is a useful intuition but not a substitute for ephemerides. The apparent Sun direction changes continuously with lunar rotation, orbital geometry and the coordinate frame. An evaluation should use a specified time standard, body-fixed transformation and published ephemeris source.

Let the local unit vectors be E, N and U, and let s be the normalized site-to-Sun direction. Then solar elevation is arcsin(s·U). Azimuth follows atan2(s·E, s·N), with explicit quadrant handling. The model must compute the Sun vector relative to the lunar site, not assume that Earth-based topocentric formulas transfer unchanged.

Solar visibility requires two tests: the Sun must be above the mathematical local horizon, and it must clear the terrain obstruction at the current azimuth. At small elevations, modest height or DEM errors can flip the result. That is why an apparent solar elevation presented to hundredths of a degree does not imply hundredth-degree accuracy.

Solar elevation(t) = arcsin(s(t) · U)(06.1)

Time-dependent solar elevation derived from normalized site-to-Sun vector s(t) and local zenith U.

ENGINEERING NOTE:The horizon and the ephemeris must be sampled against the same epoch.
07  /  TEMPORAL MODELp. 12

Illumination over mission time

A site is evaluated over intervals, not snapshots.

Start with a timeline that includes arrival, commissioning, science operations and contingency reserve. Sample the solar direction at a cadence suitable for the required result. At every time step, evaluate terrain clearance and the effective incidence angle on the solar panel normal. Record the duration and distribution of illuminated periods, not just a yearly percentage.

Two sites with identical mean illumination can have radically different power requirements. A site with short frequent eclipses may be manageable with modest storage; a site with a single long blackout may need a substantially larger battery, heating reserve or operational pause. This makes longest contiguous darkness a more informative engineering input than average sunlight alone.

For seasonal comparisons, specify the epoch and duration clearly. Moon south-pole irradiance maps are strongly time dependent. Avoid extrapolating a short summer interval into a permanent annual guarantee without simulating the complete cycle and its worst-case periods.

ENGINEERING NOTE:Decision metrics include mean visibility, longest blackout and percentiles.
08  /  ELECTRICAL POWERp. 13

From illumination to energy

Geometry becomes actionable only after equipment assumptions.

Instantaneous photovoltaic output can be approximated by solar irradiance times array area, efficiency, incidence factor and system derating. An ideal AM0 irradiance constant is a modeling input; actual delivered electrical power depends on degradation, temperature, converter losses and shading. At polar sites, the incidence term can dominate because the Sun stays low.

Battery planning must integrate energy demand over blackout intervals. Separate scientific payload duty cycles from thermal survival load, telecom peaks, avionics idle power, battery charging inefficiency and depth-of-discharge limits. A battery specification in watt-hours cannot be compared directly with a continuous heater specification in watts without duration.

An energy balance can be propagated as a bounded state-of-charge series. For each step, add harvested energy and subtract operating loads while enforcing maximum and minimum charge boundaries. The lower bound should include a protected survival reserve, not an optimistic average. Sensitivity analysis should vary both the power budget and the longest credible dark interval.

P_PV = S · Area · Efficiency · cos(i) · Derating(08.1)

Instantaneous photovoltaic power generation under solar irradiance S and panel incidence angle i.

ENGINEERING NOTE:Panel output can fall to zero before geometric sunset when a ridge intercepts sunlight.
09  /  DOWNLINK GEOMETRYp. 14

Direct-to-Earth visibility

The Earth vector is another moving target in the skyline.

A lunar surface asset may have a favorable Earth direction for much of a mission and still experience interruptions. Lunar libration changes the apparent Earth location in the sky, while surrounding terrain can occult low-elevation sight lines. Visibility should be derived from a site-to-Earth direction and compared to the local horizon exactly as for the Sun, with independent tolerances.

A geometric sight line is a necessary condition, not a completed contact. It says nothing about ground-station availability, spacecraft antenna pattern, transmit power, local pointing restrictions, or the required data rate. A strong planning tool separates geometric visibility from a feasible communications link and from a scheduled operational pass.

When Earth falls below a terrain feature, the analyst can evaluate alternatives: different antenna placements, temporary data storage, a different landing zone, or a relay architecture. A site that appears inferior on solar criteria may become attractive when the communication design is included.

ENGINEERING NOTE:Earth clearance must be assessed against a site-dependent skyline.
10  /  RADIO ENGINEERINGp. 15

A traceable X-band budget

Communication margin is a chain of assumptions.

A free-space radio budget includes transmit power, transmit gain, path loss, receive gain, atmospheric and implementation losses, system noise, modulation and coding requirements. The familiar free-space path-loss expression uses range and carrier frequency. A link margin should identify what performance threshold it measures, for example Eb/N0 or C/N0 versus a required data rate.

If a model reports a large positive number without specifying the antenna diameter, noise temperature, pointing loss and modulation threshold, it cannot be interpreted as a mission-grade margin. A change in spacecraft antenna gain or Earth range can move the result by many decibels. Likewise, communications at 8.45 GHz should not be conflated with any arbitrary DSN antenna configuration.

For engineering traceability, pair every computed margin with a parameter table and show both nominal and conservative cases. Losses and gains should be combined in logarithmic units with consistent signs. The result should be reproducible from a single row of inputs.

FSPL(dB) = 20 log₁₀(4π R / λ)(10.1)

Free-Space Path Loss over slant range R and carrier wavelength λ.

ENGINEERING NOTE:Relative bars depict budget categories; no mission flight margin is asserted.
11  /  GROUND SEGMENTp. 16

Deep Space Network context

Station coverage is dynamic operational availability.

NASA's Deep Space Network has three principal geographical complexes: Goldstone, Madrid, and Canberra. This arrangement supports global communications as Earth rotates. Each complex operates different antenna assets and mission schedules. Their existence does not mean an external project has reserved a DSN contact.

An independent mission analysis may screen whether a hypothetical lander has a line of sight to the Earth and whether an antenna of assumed sensitivity could close a theoretical link. Scheduling an actual DSN contact requires mission coordination, service arrangements and additional flight system information not supplied by geometry alone.

SelenSync should present geometry, modeled link feasibility and verified ground asset availability as distinct statuses. In a dashboard, a green 'link feasible' indicator should never be read as evidence that a particular DSS station is locked onto a lander unless that state comes from an authenticated operations feed.

ENGINEERING NOTE:DSN station names do not independently constitute operational authorization.
12  /  SURVIVALp. 17

Thermal and eclipse resilience

The mission must survive the longest credible night.

Permanently shadowed polar craters can be extremely cold. Other sites alternate between low-angle sunlight and darkness. Thermal control consequently links orbital geometry to hardware survivability. A power model that ignores heaters may exaggerate the time a payload can remain active after sunlight disappears.

At minimum, divide the mission state into illuminated operation, controlled low-power mode, full blackout survival and safe recovery. For each mode, record heater duty, avionics consumption, energy reserve and communications availability. The controller should estimate whether a state transition can occur before the battery crosses a protected threshold.

Survival planning also requires conservative boundary conditions. A thermal mass with low equilibrium temperature, unexpected eclipse extension or aging battery may be more demanding than the nominal design. A screening tool should expose these cases, ideally with a duration-at-risk output rather than a single binary safe/unsafe label.

ENGINEERING NOTE:Uncertainty grows with unverified thermal and storage assumptions.
13  /  DECISION SCIENCEp. 18

Comparing landing sites

No single weight vector is universally correct.

Site comparison requires multiple criteria: lighting, Earth line of sight, slope, scientific access, landing hazards, energy reserve and implementation cost. A weighted sum can provide a transparent initial ranking, but only after the criteria have been defined, normalized, and tagged with appropriate uncertainty. Double-counting related factors, such as sunlight fraction and derived solar energy, can bias the result.

The relative weights should be mission-specific and recorded. An optical science payload may prioritize illumination stability, whereas a radar or drilling payload might prioritize proximity to a permanently shadowed region. The correct task is not finding one universally 'best' site but identifying which site is robust under the mission sponsor's declared objectives.

Alongside the headline score, publish the per-criterion contributions and a sensitivity plot. If the winner changes after a small weight adjustment, report the ranking as fragile. If one candidate dominates across a broad scenario range, the comparison is more useful for engineering selection.

ENGINEERING NOTE:Illustrative normalized bars show why one factor cannot dictate the final choice.
14  /  ECONOMICSp. 19

Techno-economic analysis

Translate engineering burdens into attributable cost.

SelenSync includes a techno-economic analysis concept for mission cost trade-offs. The essential connection is physical: longer expected blackouts tend to require larger storage, more robust thermal management, or different operational tactics. Additional hardware mass can affect integration and delivery costs. Conversely, a relay strategy may reduce some communications constraints while introducing its own capital and operational burden.

A transparent model separates one-time hardware procurement, qualification and integration from mass-dependent transport assumptions, mission operations and expected loss exposure. An assumed dollar-per-kilogram lunar delivery cost must be treated as a scenario variable, not as a universal NASA tariff. The same is true of a notional lander capital expenditure.

The result can report cost per useful operating day, expected blackout penalty, mass delta and decision sensitivity. Financial calculations are valuable when every underlying hardware figure is explicit and the reader can substitute contractual quotations for planning assumptions.

LCMD = Mission cost / Useful mission days(14.1)

Levelized Cost per Mission Day (LCMD) normalizing total mission expenditure across productive operational duration.

ENGINEERING NOTE:Use scenario-priced inputs rather than presenting a fixed delivery price as universal.
15  /  ROBUSTNESSp. 20

Sensitivity and uncertainty

Confidence matters more than spurious decimal places.

Every output is conditional on model assumptions. Terrain grids may smooth ridge relief; ephemeris implementations depend on frame consistency; site locations have uncertainty; solar arrays differ in incidence response; radio hardware varies in antenna gain; and procurement costs are volatile. A trustworthy decision product must reveal which input uncertainty most affects the result.

A practical first method is one-factor-at-a-time sensitivity: vary DEM height bias, horizon sampling, panel derating, battery usable fraction, required link threshold and cost per kilogram. More comprehensive studies can sample input distributions, recompute candidate scores and summarize the probability of ranking changes. These are analysis probabilities under chosen distributions, not frequentist truth about the Moon.

Results should include an assumptions register and versioned execution manifest. If a model is rerun with a new terrain file, the output must retain a link to the exact file used. This is how a visually persuasive analysis becomes a defensible engineering document.

ENGINEERING NOTE:Plot each driver with a plausible range before summarizing risk.
16  /  SOFTWAREp. 21

Data engineering and APIs

Make the calculation independently reproducible.

A browser-based platform can provide immediate exploration of complex scientific datasets, but reproducibility depends on the back end and interface contract. A reliable service accepts explicit site coordinates, times, source versions and hardware settings, returning computed values together with units, timestamps, method identifiers and warnings.

Schema validation should reject ambiguous units and impossible coordinates. Longitudes need stated sign convention; elevations require a datum; RF frequencies must not silently switch between gigahertz and hertz; power inputs must distinguish watts and watt-hours. Results should support machine-readable export so a reviewer can reproduce the figures without manually copying them from a dashboard.

Caching is useful for terrain traces and ephemeris segments, provided that the cache key includes dataset version, location, sampling resolution and epoch. A visualization layer can show a simplified view while preserving downloadable full-precision values for the analyst.

ENGINEERING NOTE:Inputs, methods, assumptions and outputs should travel together.
17  /  QUALITYp. 22

Verification and model assurance

A green indicator is not a verification report.

Quality assurance begins with deterministic unit tests. Check coordinate transformations at special cases, verify solar vector normalization, confirm that horizon interpolation is continuous across 0° and 360°, and test the sign convention for clearances. Synthetic terrain shapes with known horizons are ideal tests before running noisy lunar raster data.

Next, use cross-model checks. Compare selected ephemeris epochs against a trusted reference, inspect terrain profiles against source grids, and reproduce radio arithmetic in an independent spreadsheet or script. Record expected tolerances rather than assuming exact agreement. A ten-digit telemetry readout can still be inaccurate if built on an unverified datum.

Finally, separate scientific validation from software testing. Passing integration tests proves that components work as specified; it does not establish that the chosen physical assumptions represent flight conditions. A release candidate should include data provenance, test coverage, unresolved limitations and an audit-ready run manifest.

ENGINEERING NOTE:Unit tests, independent comparisons and uncertainty review answer different questions.
18  /  RESPONSIBLE USEp. 23

What the platform cannot certify

A decision-support tool is not flight authority.

SelenSync is positioned as a lunar mission analysis and visualization platform. Its geometry and trade-off methods can support preliminary assessments, university research and engineering communication. They should not be presented as certified landing guidance, authorized NASA telemetry, an operational DSN booking or a mission assurance approval without independent documentary evidence.

Landing safety requires much finer local hazard analysis than a global or regional terrain product typically provides. Communication operations involve spacecraft-specific antennas, coding, interference and scheduling. Power survival needs qualified subsystem characteristics and thermal modeling. These domains cannot be closed by a single dashboard score.

Clear limits strengthen, rather than weaken, an investor or institutional presentation. They identify the transition from screening to high-fidelity engineering and define precisely what a product roadmap must verify. Scope honesty is part of technical credibility.

ENGINEERING NOTE:Separate public datasets, modeled forecasts, test outcomes and actual operations.
19  /  PRACTICAL GUIDEp. 24

Reproducing a site assessment

A worked analyst workflow from inputs to decision.

Consider two candidate polar sites A and B for a stationary science payload. Begin by fixing a mission epoch, a duration, a terrain data release and a common set of hardware assumptions. Export the azimuth-dependent terrain horizon at both sites; compute the Sun and Earth vectors on the same time grid. Save the configuration before looking at either result.

For each site, derive the longest uninterrupted interval with low or zero solar output, a useful-energy integral across the mission window and the fraction of time with positive Earth clearance. Evaluate downlink feasibility separately using a named notional antenna and data-rate requirement. Then estimate battery reserve and expected mission-day cost. Carry each step into a comparison worksheet.

Now perturb key inputs and ask whether the preferred site changes. A candidate with slightly lower average sunlight may still be stronger if its worst blackout is shorter and its DTE geometry is more forgiving. The final memo should report a conditional recommendation, the governing assumptions and the next evidence needed for qualification.

ENGINEERING NOTE:Export inputs first; then compare performance and risk with shared assumptions.
20  /  ROADMAPp. 25

Research and deployment priorities

What is needed for the next engineering maturity level.

The near-term priority for an engineering platform is not the number of charts it can display but the reliability of a few traceable methods. A well-scoped release can begin with polar coordinate tests, versioned LOLA terrain inputs, a consistent solar and Earth ephemeris implementation, a robust skyline solver, and downloadable result manifests.

The next priority is calibration. Compare predicted illumination boundaries with independent historical NASA visualizations and available instrument-derived products. Benchmark performance without treating interactive latency as a proxy for scientific accuracy. For communications, test link-budget arithmetic separately from station availability and access permissions.

The longer-term opportunity is to incorporate mission-specific power hardware, integrated thermal cases, uncertainty propagation and economically meaningful procurement inputs. Each layer should be introduced with regression tests and clear documentation. A system that says precisely what it knows, and what remains to be measured, is the strongest foundation for institutional adoption.

ENGINEERING NOTE:Build verified capability progressively rather than combining unsupported claims.
21  /  WORKED ANALYSISp. 26

A solar and battery calculation

A traceable numerical scenario with specified assumptions.

Consider an array with projected area 4.0 m², cell efficiency 28%, incidence factor 0.35 and electrical derating 0.85. With reference solar irradiance 1,361 W/m², delivered power while illuminated and unblocked is approximately 453.07 W (453 W). This scenario is a calculation, not a flight-validated SelenSync output.

Next, assume a survival load of 120 W for a continuous 36-hour terrain blackout. Required delivered energy is 4.32 kWh. At 80% usable depth of discharge and 92% discharge-chain efficiency, nominal storage becomes about 5.87 kWh. These values exclude battery aging, low-temperature derating and transient loads.

Power Output: 1,361 × 4.0 × 0.28 × 0.35 × 0.85 = 453.07 W(21.1)

Delivered photovoltaic power during unobstructed polar illumination.

Battery Energy Demand: E = (120 × 36) / (0.80 × 0.92) = 5.87 kWh(21.2)

Nominal storage sizing for a 36-hour continuous terrain shadow interval.

DESIGN INTERPRETATION:Long blackout duration, rather than average sunlight percentage alone, governs storage sizing. Mission design must test credible worst-case shadow intervals and thermal loads.
22  /  WORKED ANALYSISp. 27

Direct-to-Earth path loss

Converting transmission distance and X-band frequency into a propagation term.

Free-space path loss (FSPL) measures geometric signal spreading through ideal space. With nominal Earth range 384,400 km and transmission frequency 8.45 GHz, the path loss is approximately 222.68 dB. This does not establish whether a communications link closes.

The complete budget starts with transmitter power and antenna gains, subtracts propagation, pointing and implementation losses, then evaluates received energy per bit, coding and data-rate requirements. An unobstructed Earth vector does not guarantee an available DSN station, scheduled contact or positive margin.

FSPL = 20 log₁₀(4π R f / c) ≈ 222.68 dB(22.1)

Evaluated at nominal lunar range R = 384,400 km and X-band frequency f = 8.45 GHz.

GROUND SEGMENT LIMIT:This theoretical calculation is not proof of NASA Deep Space Network access. Operational service and scheduling require separate coordination.
23  /  COMPUTATIONAL PRACTICEp. 28

A visibility kernel (Python implementation)

Reference Python for a site-dependent horizon test.

The fundamental operation compares an apparent target elevation against an interpolated skyline height at the same azimuth. This small Python function accepts a uniformly sampled 360° horizon in degrees and returns signed clearance.

A production implementation must validate sample coverage, missing DEM values, the 0°/360° wraparound, reference frames, and sensor height. The same kernel is called for solar and Earth vectors; the upstream source of each vector remains distinct.

Listing 23.1 — visibility_kernel.py
def clearance_deg(az_deg, el_deg, horizon):
    """
    Computes signed clearance angle against an interpolated horizon mask.
    """
    az = az_deg % 360.0
    step = 360.0 / len(horizon)
    left = int(az // step)
    right = (left + 1) % len(horizon)
    frac = (az / step) - left
    obstruction = (1.0 - frac) * horizon[left] + frac * horizon[right]
    return el_deg - obstruction
REPRODUCIBILITY REQUIREMENT:Export the site, epoch, dataset release, assumptions, software version and warnings. A screenshot without this manifest is not an independently reproducible scientific result.
24  /  SELENSYNC SITE REGISTERp. 29

Polar candidate locations

Site inputs from the SelenSync project browser.

The platform includes a set of named high-latitude locations for screening and comparative simulation. The coordinates below reproduce the project reference inputs, not certified landing ellipses. Formal use requires an agreed reference frame, elevation datum and terrain data version.

Table 24.1 — SelenSync Polar Candidate Locations (> 84° S)
LocationLatitudeLongitudeRole / Context
Malapert Massif-85.99°2.93°Candidate Screening Site
Shackleton Connecting Ridge-89.90°0.00°High Illumination Zone
de Gerlache Rim-88.50°-88.30°Polar Slope Context
Haworth Crater Rim-87.40°-5.10°PSR Boundary Site
Faustini Rim Plateau-87.30°77.00°Communication Candidate
Nobile Rim 1-85.20°33.50°Volatile Exploration Zone
Amundsen Rim Highlands-84.50°82.80°High Elevation Terrain
Leibnitz Beta Plateau-86.80°29.80°Comparative Simulation
REGISTER STATUS:A site included in a research browser is not automatically an approved NASA or CLPS landing site. Candidate status is mission-specific and subject to independent verification.
25  /  PLATFORM PRACTICEp. 30

Modules and outputs

The analytical modules described by the SelenSync development team.

SelenSync links a three-dimensional lunar viewer, trajectory and illumination analysis, terrain masking, communications checks and techno-economic comparison. Each module should preserve site coordinates, temporal epoch and the provenance of its input data.

Results are most useful when exported with their assumptions and uncertainties. The user interface is an analytical lens onto models, not a flight-operations authorization system.

013D South Pole viewer
Terrain and site selection with slope context.
02Solar and skyline profiler
Sun elevation, horizon mask and blackout duration.
03DTE communications
Earth clearance and theoretical RF feasibility.
04Power and thermal assessment
Array output, usable storage and survival loads.
05Mission finance / TEA
Mass-cost assumptions, mission-day economics and sensitivity.
DATA OWNERSHIP AND CREDIT:The platform and this publication are authored by the six SelenSync authors. NASA data sources are independently acknowledged; using public data does not imply NASA certification.

Glossary & Abbreviations

p. 31
Body-fixed frame
Coordinates rotating with the Moon, required for surface analysis.
DEM
Digital elevation model representing sampled lunar surface height.
DTE
Direct-to-Earth line of sight and communications assessment.
DSN
NASA Deep Space Network ground communications system.
Ephemeris
Time-dependent calculated positions of celestial bodies.
FSPL
Free-space path loss, an idealized signal-spreading term.
Horizon profile
Maximum obstacle elevation for each azimuth.
Libration
Apparent variation of Earth in the lunar sky.
LOLA
Lunar Orbiter Laser Altimeter aboard LRO.
PSR
Permanently shadowed region.
State of charge
Remaining stored battery energy as a fraction of rated capacity.
TEA
Techno-economic analysis connecting engineering and economic scenarios.

References & Data Sources

p. 32
  1. NASA Science. Shadows near the Moon's South Pole. https://science.nasa.gov/resource/shadows-near-the-moons-south-pole/
  2. NASA Science. Shackleton Crater's illuminated rim and shadowed interior. https://science.nasa.gov/resource/shackleton-craters-illuminated-rim-shadowed-interior/
  3. NASA Science. Lunar Reconnaissance Orbiter overview. https://science.nasa.gov/mission/lro/
  4. NASA Scientific Visualization Studio. Illumination at the Moon's South Pole, 2023 to 2030. https://svs.gsfc.nasa.gov/4930/
  5. NASA. Deep Space Network complexes. https://www.nasa.gov/directorates/somd/space-communications-navigation-program/dsn-complexes/
  6. NASA. Commercial Lunar Payload Services overview. https://www.nasa.gov/commercial-lunar-payload-services/
  7. SelenSync authors. Project presentation and technical platform description, 2026. https://selensync.vercel.app/

The Six Authors

p. 33

Md Golam Mubasshir Rafi1*

ORCID: 0009-0007-4015-8354

Team Lead · Product Architecture & Mission Strategy

Army Institute of Business Administration, Sylhet

Afshara Tasneem Zoa2

ORCID: 0009-0004-9322-8465

Co-Lead · Scientific Research & Systems Strategy

BRAC University

Kaiba Hasnat2

Frontend & UI · Avionics Interface & Telemetry UI

BRAC University

Labiba Mahzabin2

Data & GIS · Planetary GIS & Data Engineering

BRAC University

Nafiz Akib Khan2

Analytics · Power Budgeting & Feasibility Modeling

BRAC University

Nishat Jahan Nowshin2

Communications · Mission Communications & Public Outreach

BRAC University

BIBLIOGRAPHIC RECORD & CITATION

How to Cite This Work

Recommended Citation (APA)

Rafi, M. G. M., Zoa, A. T., Hasnat, K., Mahzabin, L., Khan, N. A., & Nowshin, N. J. (2026). SelenSync: Engineering Lunar South Pole Mission Intelligence. Algorism Press. ISBN: 978-984-35-8943-8.

@book{rafi2026selensync,
  title     = {SelenSync: Engineering Lunar South Pole Mission Intelligence},
  author    = {Rafi, Md Golam Mubasshir and Zoa, Afshara Tasneem and Hasnat, Kaiba and Mahzabin, Labiba and Khan, Nafiz Akib and Nowshin, Nishat Jahan},
  year      = {2026},
  month     = {oct},
  publisher = {Algorism Press},
  address   = {Dhaka Cantonment, Bangladesh},
  edition   = {First},
  isbn      = {978-984-35-8943-8},
  note      = {Print ISBN: 978-984-35-8942-1; Edition Ref: AP-SS-2026-01},
  url       = {https://algorismpress.gmrafi.com.bd/book/ndzaczf7}
}